Dijikstra Visualizer
An interactive React-based visualizer that demonstrates Dijkstra’s shortest path algorithm on a 2D grid, showing how nodes are explored and the most efficient path is calculated.
Tools:
React.js
Short Explanation
This visual tool lets users place start and end nodes, create walls as barriers, and watch Dijkstra’s algorithm find the shortest path in real time. Smooth animations highlight visited nodes and the final path, providing an intuitive, step-by-step way to understand how the algorithm works on a grid.
Tech Stack Used
- React.js: A frontend library used to build dynamic user interfaces, manage state, and render components efficiently.
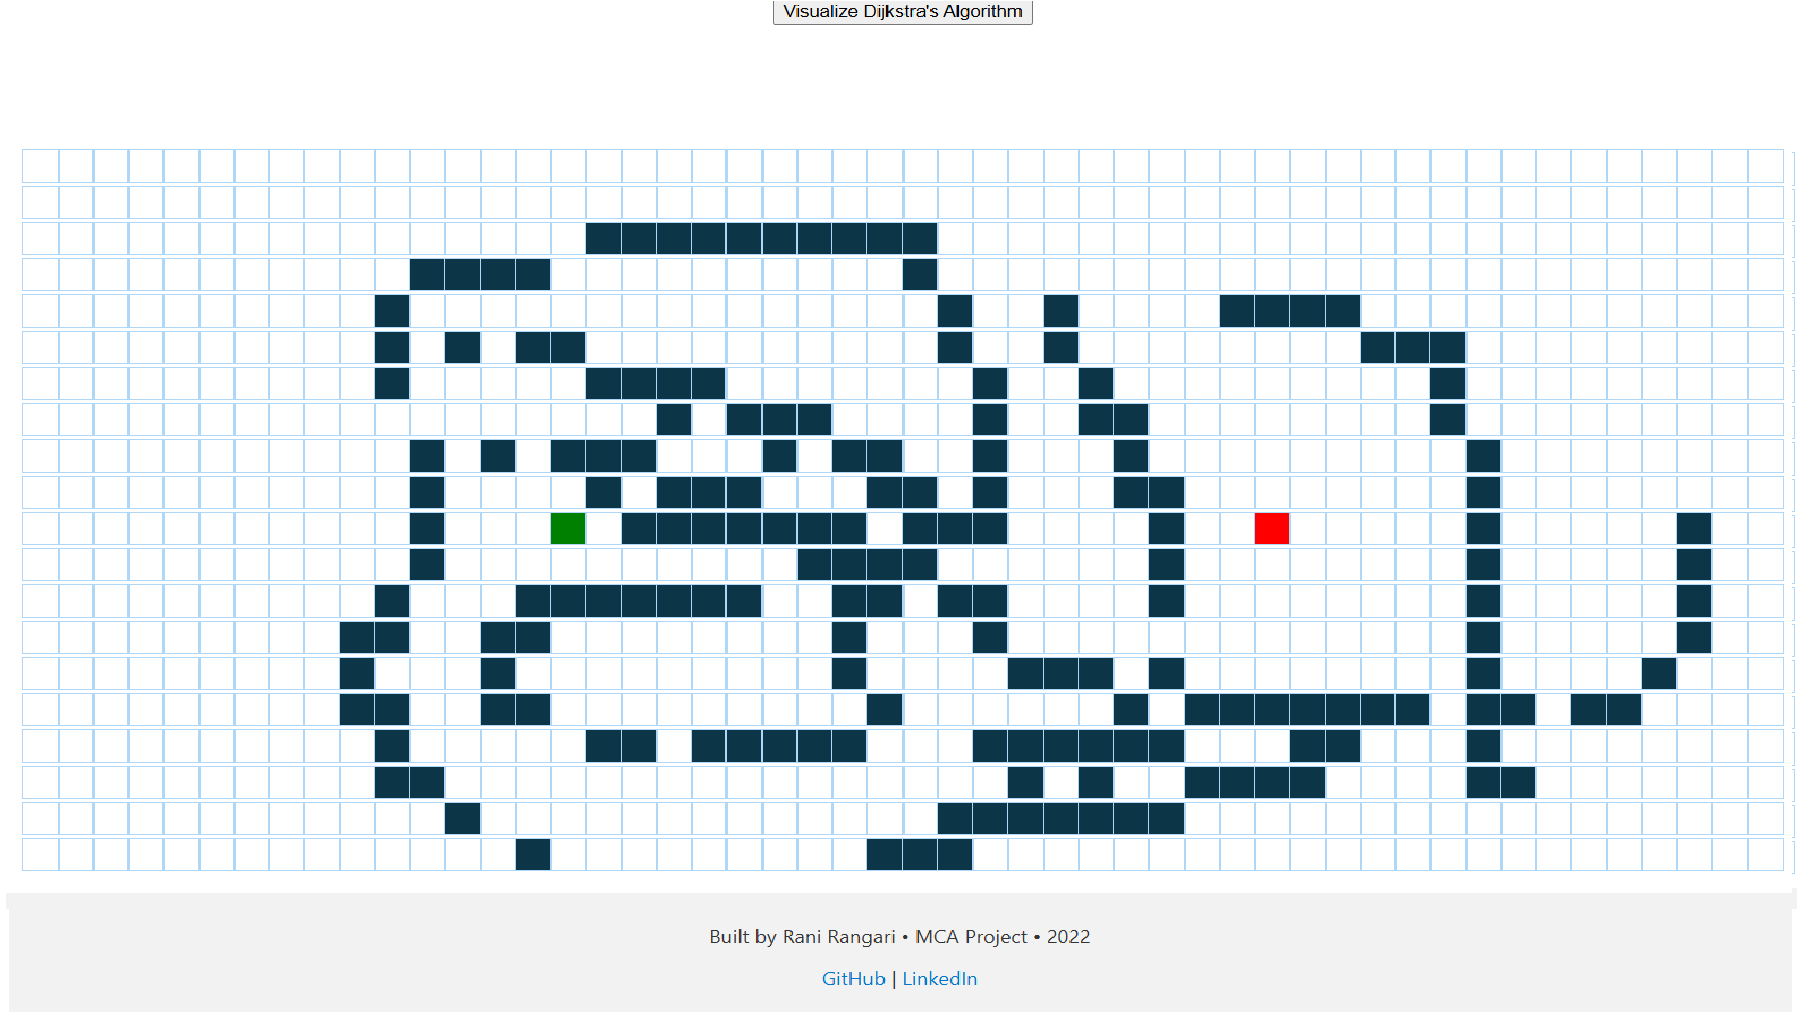
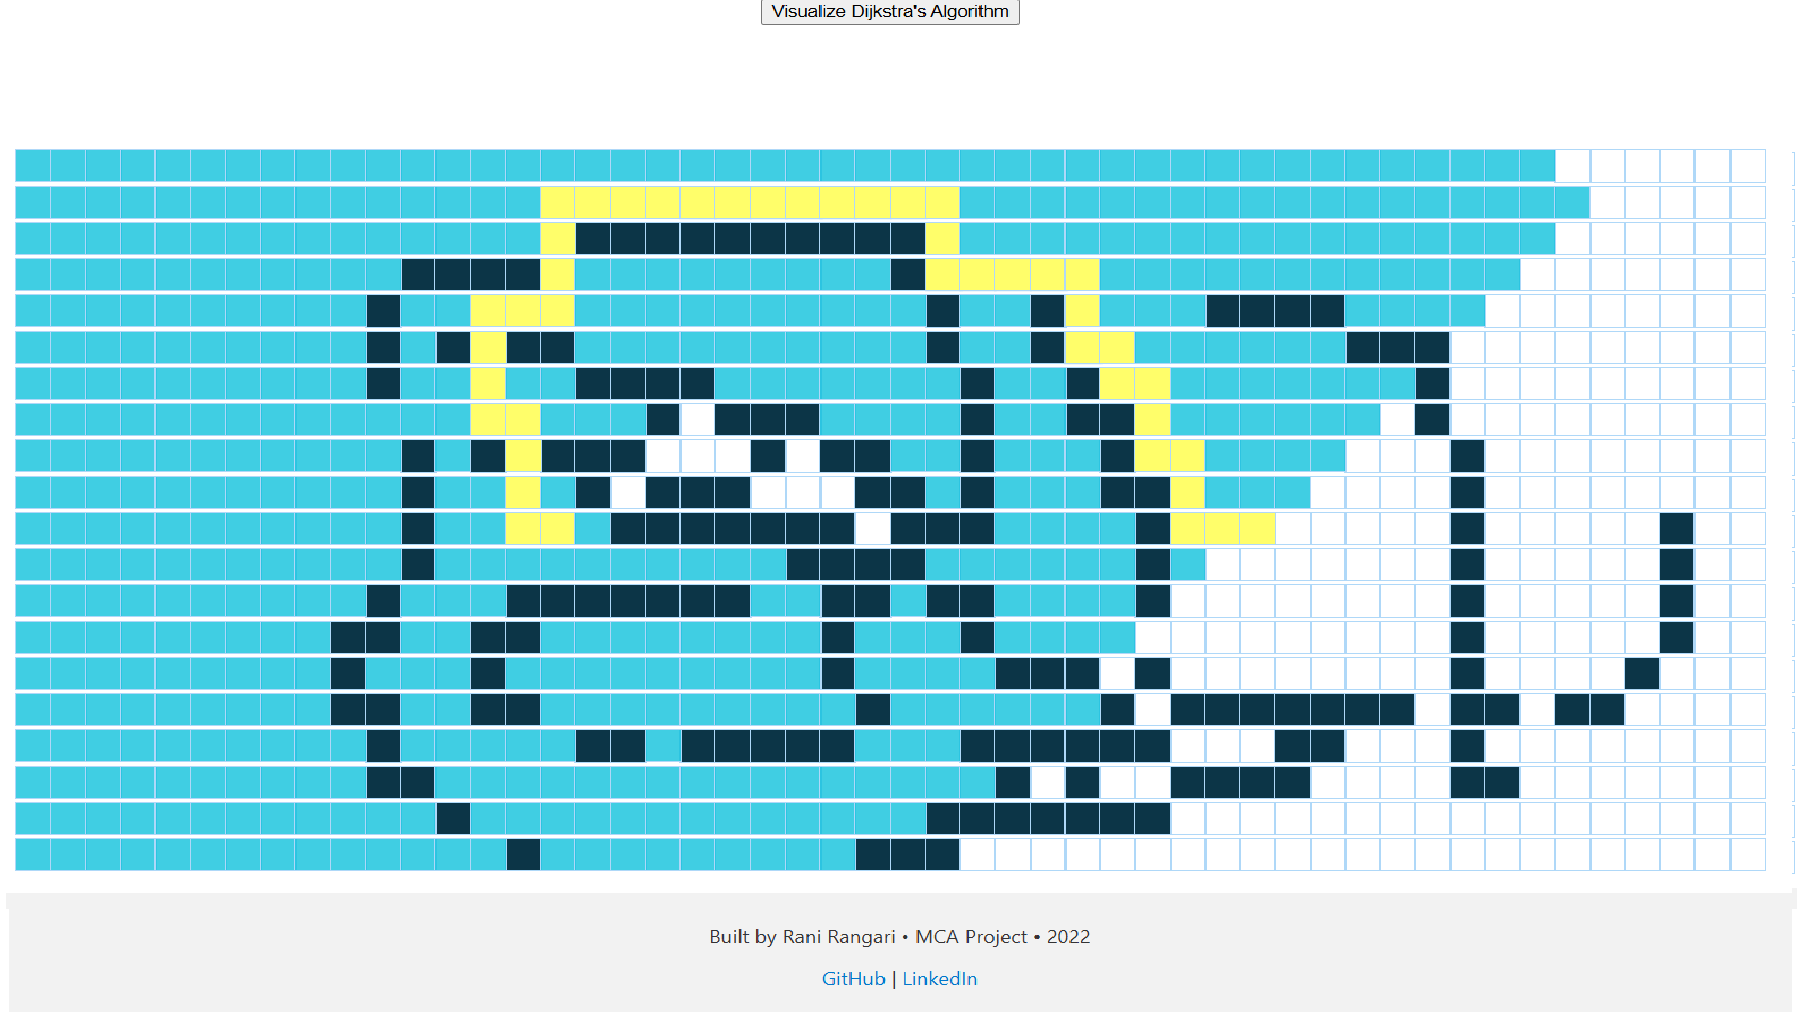
Image Preview
A quick look at some UI shots from the project:
Lessons Learned
- I learned how to manage dynamic grid states in React, handle user interactions like adding walls or moving nodes, and create smooth, intuitive animations that make complex algorithms easier to visualize. This project strengthened both my algorithmic thinking and frontend development skills.